Finding places where CPU use in Mesa can be improved is a great place to start contributing to Mesa. It doesn't require you to know much about how Mesa works to get started, but at the same time you will quickly learn how things fit together as you follow the output from profiling applications.
Also you don't necessarily need to be a super programmer to identify hotspots in the code and try to come up with a way to reduce CPU as I will hopefully show you below.
Back-Story
Earlier in the year I was reading some bench marking results at Phoronix comparing the open source Radeon driver against the closed source catalyst driver. For some older games like OpenArena the radeon driver was only a small way behind catalyst for most cards but for the higher end radeon cards catalyst started to leave the radeon driver in the dust. Upon reading the following comments about the results in the phoronix forums the speculation was that the open source drivers are causing a cpu bottleneck on the higher end cards. This got my attention so I decided to investigate further.
The first step was finding a way to profile the driver code in a repeatable manner, so I attempted to write a module for the Phoronix Test Suite (pts) that would automatically run the oprofile tool on any of the benchmarks. Unfortunately there turned out to be a couple of issues in making this work reliably, the biggest problem is that when pts issues the command to run the benchmark it doesn't actually issue the final command it usually just calls a shell script in the games install directory that does a few things then goes on to run the benchmark, this makes getting the process id that oprofile needs difficult and error prone, also running tools like callgrind becomes hard. To make this tool work these shell scripts really need to be replaced and the final call to launch the benchmark come from pts itself. I imagine this would be a whole lot of work and testing as every benchmark would need to be reworked which I didn't really have time for so I moved on.
In the end I just took the final command and used that directly with callgrind (its slower than oprofile but it makes measuring small improvements more accurate).
The first thing I noticed when profiling the OpenArena benchmark was how high the cpu usage was for OpenAL, around 14% of all cpu being used during the benchmark was spent processing sound for the game. That seemed way to high so rather than looking at the Mesa drivers I ended up jumping into OpenAL instead. It turned out that depending on your sound card the sound can end up needing to be re-sampled which can be very cpu intensive. And after a bit of a learning curve I ended up submitting a patch that implemented SSE optimisations to significantly reduce CPU use from 14% -> 7%. This change is part of the recently released OpenAL 1.6.
This is pretty much where I left things back in June, as I don't have a high end Radeon card myself I was unable to confirm if this change made an difference to frame rates and ended up moving on to other Mesa work.
Last week however I decided to take another look at my profiling results and as a result ended up submitting a patch to Mesa which reduces cpu use during the OpenArena benchmark by just over 2.5%. Again I have no idea if this actually helps boost frame rates on high end cards but reducing cpu is always good 🙂
Using Phoronix Test Suite to Profile CPU Use
First things first you should be profiling the version of Mesa from git. If you don't already have it setup you can see my previous guide for doing so here.
To get Phoronix Test Suite you can clone from git with the following command:
git clone https://github.com/phoronix-test-suite/phoronix-test-suite.git
Then simply go to the new directory and run the main script to start using it:
./phoronix-test-suite
Once you have installed the benchmarks you want to play with you can the run one of them and you will see the command that actually runs the benchmark in the console. On my machine for OpenArena this is:
./openarena.x86_64 +exec pts-openarena-088 +set r_mode -1 +set r_fullscreen 1 +set com_speeds 1 +set r_customWidth 800 +set r_customHeight 600
Now to profile this with callgrind all you need to do is install valgrind (if you don't already have it) and go to the benchmarks install directory:
cd ~/.phoronix-test-suite/installed-tests/pts/openarena-1.5.2/openarena-0.8.8
And you can then run the benchmark in callgrind using a command like this:
valgrind --tool=callgrind ./openarena.x86_64 +exec pts-openarena-088
+set r_mode -1 +set r_fullscreen 1 +set com_speeds 1 +set r_customWidth
800 +set r_customHeight 600
Note: callgrind takes a while to setup its environment and is pretty slow when running, so if you are just seeing a black screen don't reset you computer be patient it will get there 🙂
Understanding Profiler Output
Once callgrind has finished running you will have a new file in the games directory named something like: callgrind.out.26859
In case you were wondering the number is just the process id of the application you just profiled.
Now the rest couldn't be easier. All you need to do is install a great tool called KCacheGrind, now you can open this file and will have an excellent overview of where cpu time was spent throughout the benchmark. It will even display the cpu use percentages next to lines of code, as well as many other great features such as sorting by time spent in functions, just take a look around yourself.
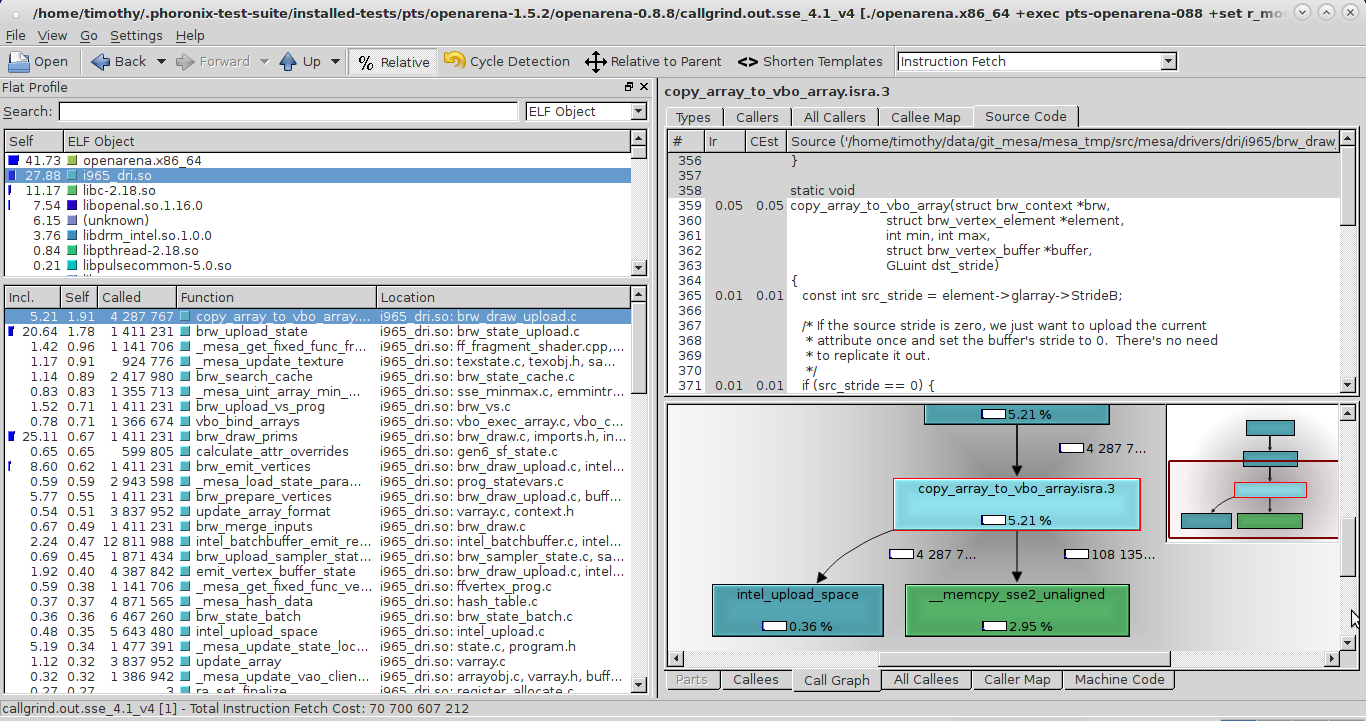
Screenshot of KCacheGrind
Optimisation Solutions
Once you have spotted something that's hogging the cpu you can start looking at what can be done to reduce that use. I'm not going to go into detail of all the possible optimisation techniques available as there is plenty of information about that out there, google is your friend. The thing I have been looking at the most is making use of the SSE/AVX functionality available in modern processors, Mesa currently doesn't do a whole lot of these optimisations so there is probably a whole bunch of low hanging fruit out there.
One place that sticks out as a possible place for optimisation is the various hash functions scattered throughout Mesa. For example the hash_key function in the intel i965 driver is one of the largest uses of cpu remaining during the OpenArena benchmark around 0.7% and has a comment above it saying “I'm sure this can be improved on”. There is also a comment like this in the gallium cso_cache.c hash_key function. And the _mesa_hash_data function is another 0.3% of cpu, it uses the FNV-1 hash which I have seen SSE versions of floating around. Another option might be making use of the CRC32 SSE instruction to do some hashing although I haven't looked into it enough to know if it would be suitable or even faster for that matter.
Anyway my point is there is a lot of places someone could look at improving cpu use without much previous knowledge of the Mesa codebase.
If you do decide to have a go at improving something I would be interested to hear about it so feel free to leave a comment below. Also if your not a programmer but decide to do some profiling and see something that looks unusually high then feel free to leave the details below also.
One final link that might be helpful is my guide on How To Start Contributing To Mesa.
Update: Here is a really useful link I forgot to include that lists the intrinsic instructions and allows you to easily group and search them. https://software.intel.com/sites/landingpage/IntrinsicsGuide/
Testing my patches
If anyone out there has a cpu with SSE4.1 and a high end Radeon card I would be interested to know if my patch does actually have any effect of the frame rate in OpenArena. Just leave a comment below.
I think Mesa's texture compression bits (s3tc, rgtc, ...) are good candidates for SSE optimizations; you can even go further by using multiple worker threads in background to do the job. This will reduce the time it takes to load textures and minimize possible in game hiccups when loading new (uncompressed) textures. ( http://mrelusive.com/publications/papers/Real-Time-Dxt-Compression.pdf )
By the way, I'd first go hunting for cache misses and rearrange the data if possible; then using SSE to process streams of data.
Any advice/good links on how one would go hunting for and resolve cache misses?
I guess you can use KCachegrind to spot cache misses using same procedure as before, you should look for *L2* or *Last Level* cache misses somewhere in menus. Cache misses usually happen when you are accessing array members non sequentially, or reading unnecessary data (big structures and classes) from memory.
You should try to modify your loops and avoid random access to array members if possible. And try to use Structure-Of-Arrays instead of Array-Of-Structures (or a hybrid of them) to avoid reading and polluting CPU cache with unnecessary data.
This is a nice read on topic:
http://research.scee.net/files/presentations/gcapaustralia09/Pitfalls_of_Object_Oriented_Programming_GCAP_09.pdf
And these too:
http://techpubs.sgi.com/library/dynaweb_docs/0640/SGI_Developer/books/OrOn2_PfTune/sgi_html/ch06.html
http://gameprogrammingpatterns.com/data-locality.html
I'm using QtCreator which does have a nice frontend to Valgrind and friends:
http://cubeupload.com/im/siavashserver/qtcreatoranalyzecach.png
You can also use *perf* for faster profiling:
http://www.pixelbeat.org/programming/profiling/
I like to watch the Mesa mailing list and I saw your patches. Great stuff; I was kind of surprised this was not already implemented considering how easy it was to implement. Is there already a list of low- performance areas that need addressing? I'm pretty familiar with x86 SIMD instruction sets and haven't yet submitted a useful patch to Mesa - might be a fun challenge. 🙂
Not that I'm aware of. Its just a case of doing a bit of profiling and seeing whats what.
You could check on the mailing list starting a list (if they don't have one already) might be of interest to the devs.
I have been thinking about this and I would be interested in working on building a list of cpu hotspots in the Mesa codebase. Let me know if you are interested in helping out.
I've added a wiki to my site and started creating a list here: http://www.itsqueeze.com/wiki/index.php?title=Main_Page
Anyone is welcome to add to it 🙂
I really liked the warning at the top of the page, saying that I am using a Proprietary OS, and recommending Fedora !
Thanks. That's a WordPress plugin I created a few of years ago.
http://www.itsqueeze.com/2011/06/wordpress-linux-promotional-plugin/
I had a deeper look at your patch. I think you can extend your patch to accelerate finding min/max of other types of index buffers (GL_UNSIGNED_SHORT which is pretty common and GL_UNSIGNED_BYTE) using SSE4.1 _mm_min/max_epu16 and SSE2 _mm_min/max_epu8 intrinsics.
Good luck!
Yep they could be done too. The reason I didn't do it in the first version of my patch is because the benchmark I was testing will never hit them.
Any ideas by calling which OpenGL function (and how) *vbo_get_minmax_index* will be triggered with your optimized path?
Its used for glDrawElements(). It's recommend to use glDrawRangeElements() to avoid this path all together.
Yup, I just asked on #dri-devel and it appears that it only triggers on pretty weird usage of glDrawElements without providing a separate index buffer.
By the way I just modified SSE4.1 version of Bruno Jimenez's benchmark file posted on mesa-dev mailing list. It performs faster by prefetching data from memory into CPU cache ahead using software prefetching hints and loop unrolling to utilize out of order execution 🙂
Here is the modified version:
http://paste.kde.org/pim9dtsta
Thanks again for your hard work on Mesa!
Hmm. This now means your forced into processing arrays by 16 elements at a time. If there are lots of smaller sized arrays being processed this could result in worse performance.
Anyway I'm not sure for the extra code and small performance gain if its worth it or not.
If you are interested in looking for some places you could implement some SSE changes in Mesa I'm starting to build a list here: http://www.itsqueeze.com/wiki/index.php?title=Main_Page
Here is a nice chart for you: http://imgh.us/chart_1.svg
Would using AVX256 help processing audio even faster in modern Zen 2 CPUs?